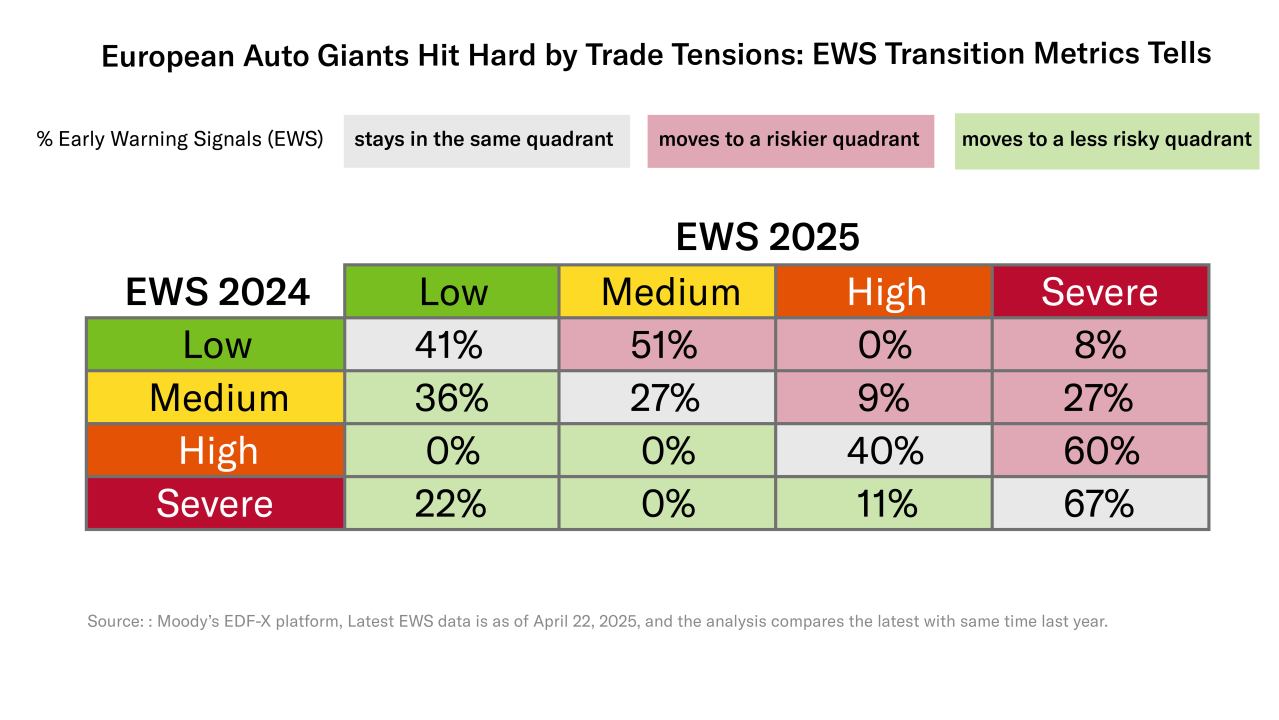
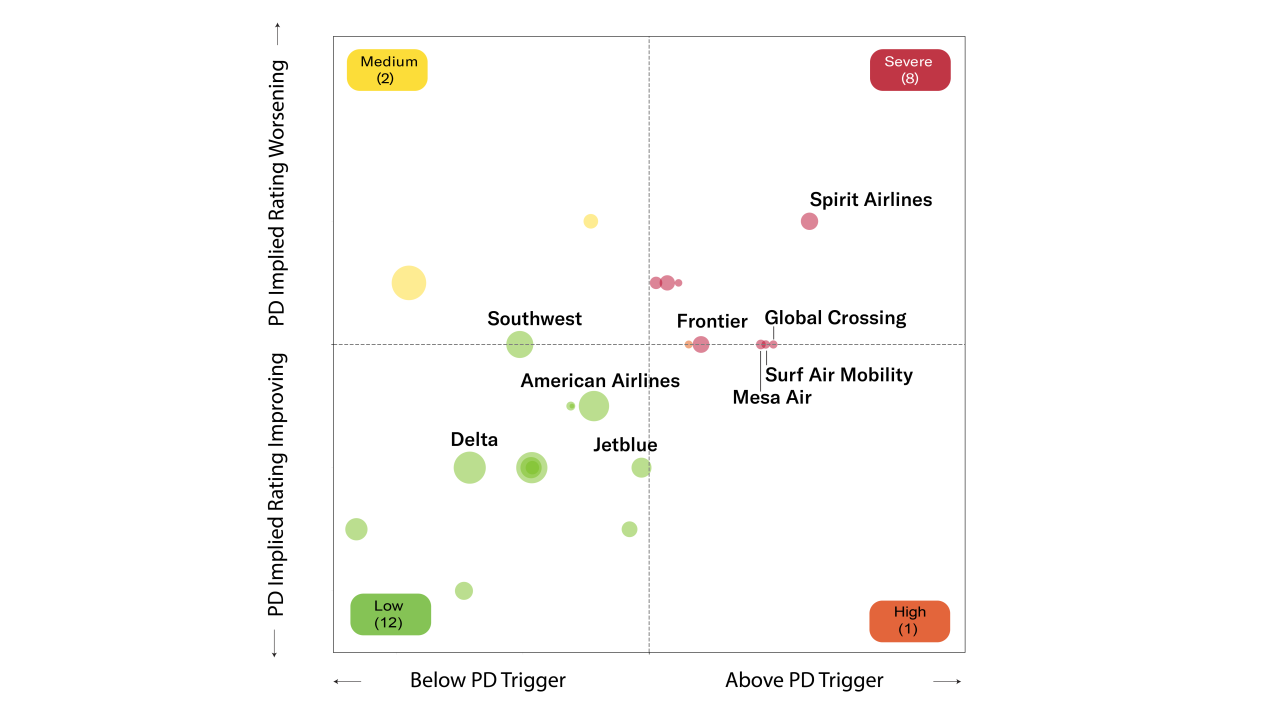
Corporate Credit Risk Looking for a Catalyst to Break Out
Data analysis, Data automation, Data Visualization, Generative AI, Adobe Illustrator The story is a monthly updated report based on a data analysis pipeline. The idea is to track the corporate credit risk by a set of financial metrics, and to decode the data with market insights. It's published on Moody's.com.
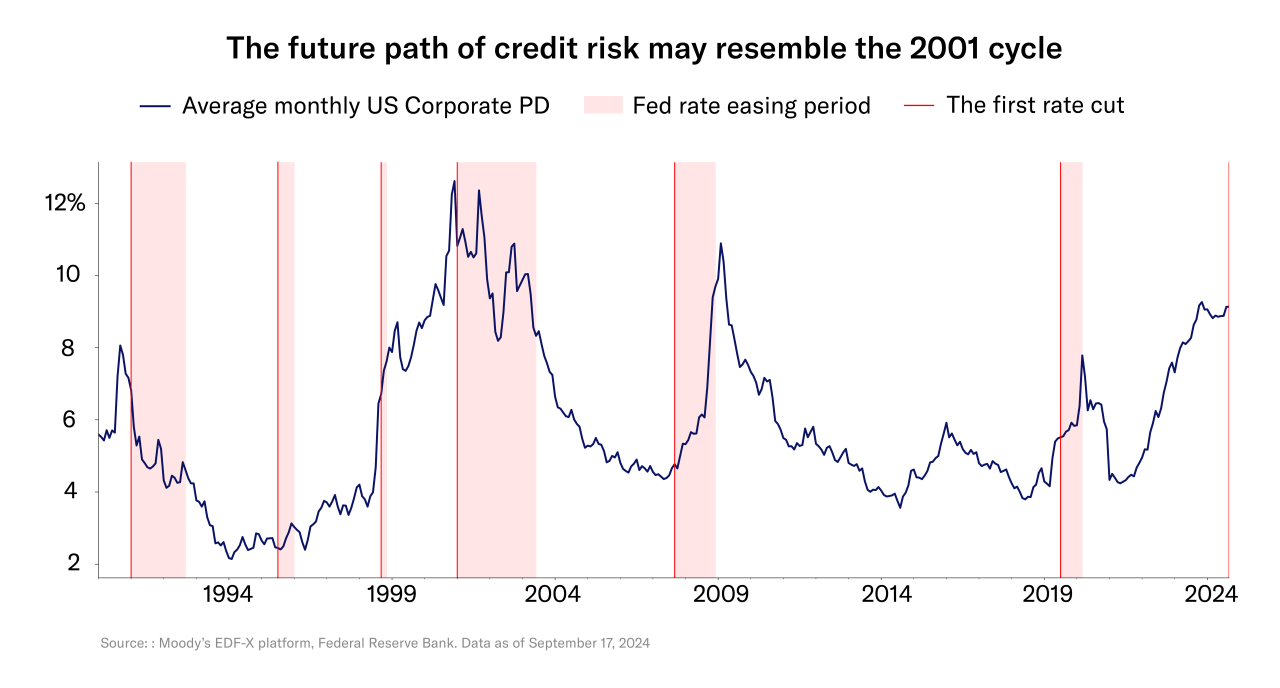
US firms’ default risk hits 9.2%, a post-financial crisis high
Data analysis, Data automation, Prototyping, Financial Reporting The story is built upon a data analysis pipeline by tracking the probability of default for US public companies. It extends legacy database and models into analytics, weaving in market trends and macroeconomy insights. It aims to be an every-green data tracker, plus in-depth knowledge from domain experts. The story is a special edition, published on Moody's.com.
COVID-19 & ONLINE SURVEILLANCE: How China's contact tracing app is affecting travelers
Vanilla.js, Scrollama, Mapbox, Web dev, Data analysis, Adobe Illustrator, Social media fact-checking In response to the lack of comprehensive coverage on non-western world's usages of the contact tracing apps systems, I reported and built the story trying to show how China's massive surveillance with the QR health code system came into effect. It offers a chronologically ordered and geographically marked view to help the readers understand the development of this system. The Chinese version of the story was published on FTChinese.
Data show panic and disorganization dominate the study of Covid-19 drugs
Exploratory data analysis, Python Matplotlib, Adobe Illustrator In collaboration with the data engineer and the beat reporter on the team, I dug in the clinicaltrials.gov trying to find data patterns around COVID-19 related drug studies. The story we produced reveals the disorder and disorganization with huge financial resources wasted in COVID-19 clinical studies. I cleaned and analyzed the dataset, iterated story ideas with the field jouranlist from STAT News, and futhur improved the data pipeline. I also tested how to leverage data trackers in news reporting. Published on STAT News.
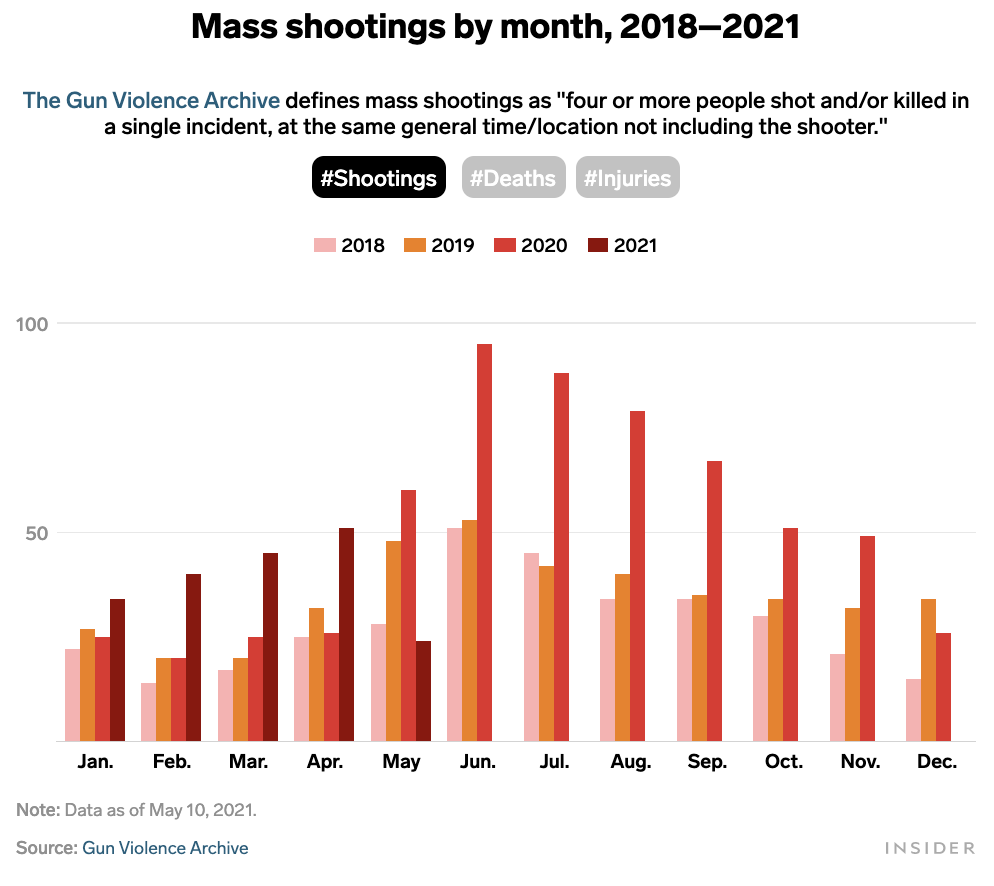
US mass shooting tracker
Data tracker, News automation, Pandas, Datawrapper
According to the Gun Violence Archive, a nonprofit that tracks shootings in the US, there have been nearly 200 mass shootings in 2021 alone — and that tally does not appear to be slowing down anytime soon. To track the incidents, I created a python script to scrape and parse the GVA database. The data viz wil automatically update every time I run the python script. The charts are published at Business Insider.
"Joanna's Chart of the Week"
"Chart of the week" is a personal brand hosted by Joanna within Moody's. She leverges her research works and published articles in the creation data visualized explainers. These are short pieces for educating general audience for market movements and macroeconomy trends. See more on LinkedIn